Background
survival::rotterdam is a richer oncology survival
dataset than veteran, with tumor biology and treatment
variables that allow a more structured heterogeneity analysis.
Objective
The goal is to study whether chemotherapy benefit varies with baseline disease burden and receptor-related biomarkers.
At horizon years, the forest targets subgroup-specific survival effects summarized as RMST differences or survival-probability differences, depending on the chosen target.
Analysis setup
dat <- prepare_case_rotterdam()

fit <- fit_survival_forest(
  data = dat,
  time = "time",
  event = "event",
  treatment = "treatment",
  covariates = setdiff(names(dat), c("sample_id", "time", "event", "treatment")),
  sample_id = "sample_id",
  horizon = 8,
  seed = 123,
  num_trees = 400,
  tree_minbucket = 120
)
#> Warning in grf::causal_survival_forest(X = as.matrix(analysis_data[,
#> covariates, : Estimated censoring probabilities go as low as: 0.01298 - an
#> identifying assumption is that there exists a fixed positive constant M such
#> that the probability of observing an event past the maximum follow-up time is
#> at least M (i.e. P(T > horizon | X) > M). This warning appears when M is less
#> than 0.05, at which point causal survival forest can not be expected to deliver
#> reliable estimates.
#> Warning in get_scores.causal_survival_forest(forest, subset = subset,
#> debiasing.weights = debiasing.weights, : Estimated treatment propensities take
#> values very close to 0 or 1. The estimated propensities are between 0 and
#> 0.984, meaning some estimates may not be well identified.

fit$check_table
#>             check_name        value status
#> 1            rows_used 2982.0000000   info
#> 2 rows_dropped_missing    0.0000000     ok
#> 3           outcome_sd    3.5539427     ok
#> 4         treatment_sd    0.3958819     ok
#> 5       treatment_rate    0.1945003   info
#> 6      covariate_count   14.0000000   info
#> 7           event_rate    0.4265594     ok
#> 8          censor_rate    0.5734406   info
#> 9              horizon    8.0000000   info
fit$subgroup_table
#>   subgroup                               rule   n effect_mean effect_low
#> 1       G1 pgr>=4.069 & er>=4.256 & age>=46.5 260   0.7164752  0.6790153
#> 2       G4 pgr>=4.069 & er< 4.256 & age< 47.5 667   0.5857752  0.5695050
#> 3       G5 pgr< 4.069 & er>=2.862 & age>=47.5 156   0.7991407  0.7517246
#> 4       G7 pgr< 4.069 & er< 2.862 & size< 0.5 312   0.7210948  0.6936052
#> 5       G8 pgr< 4.069 & er< 2.862 & size>=0.5 488   0.9591277  0.9351884
#>   effect_high
#> 1   0.7539350
#> 2   0.6020454
#> 3   0.8465568
#> 4   0.7485845
#> 5   0.9830670
Design view
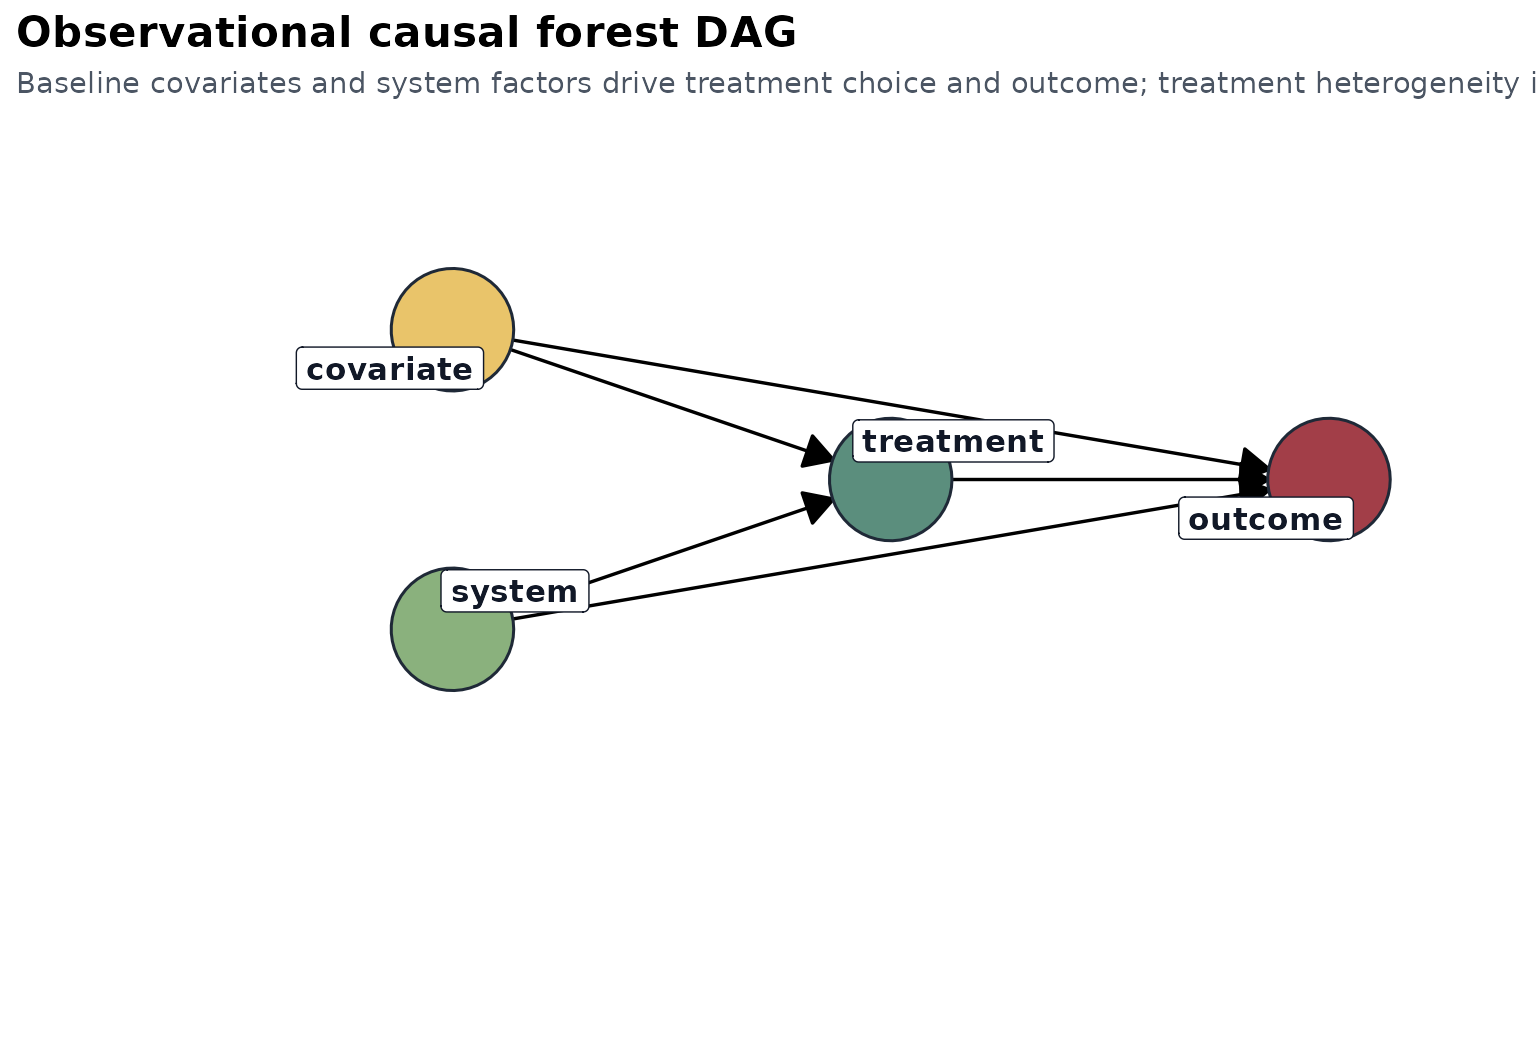
The interpretation is observational: baseline clinical and tumor features are used to adjust treatment comparisons and to discover effect modifiers.
Treatment and observed time
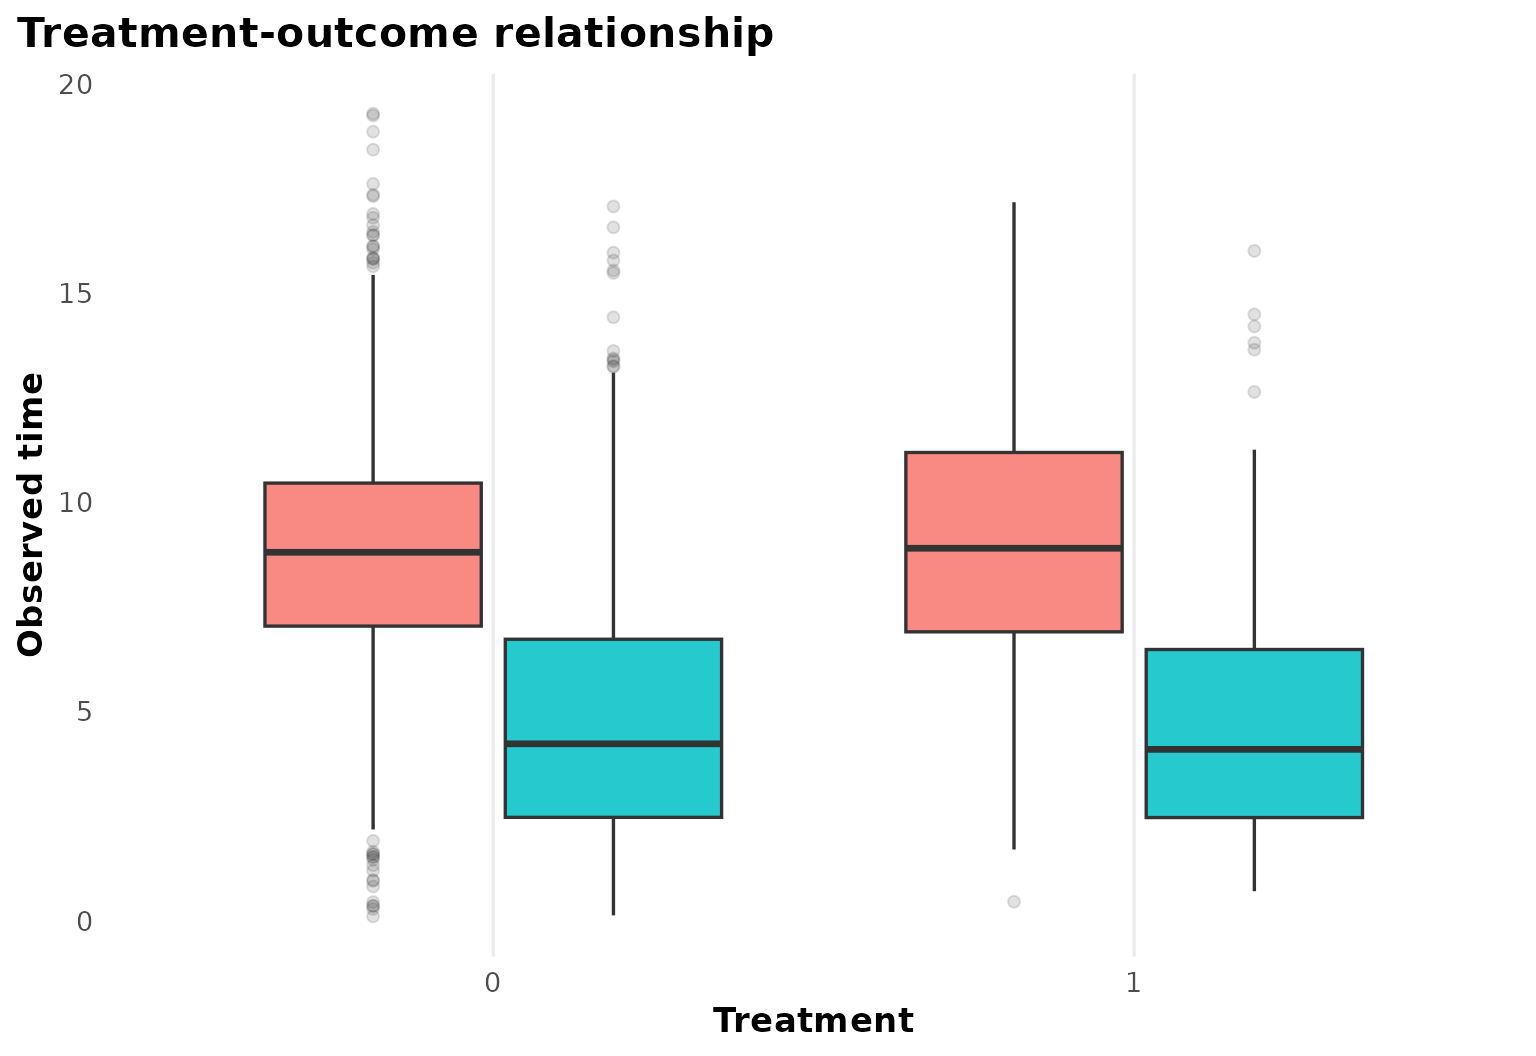
The treatment-outcome panel gives a first sense of follow-up scale and censoring.
Heterogeneous effect summary
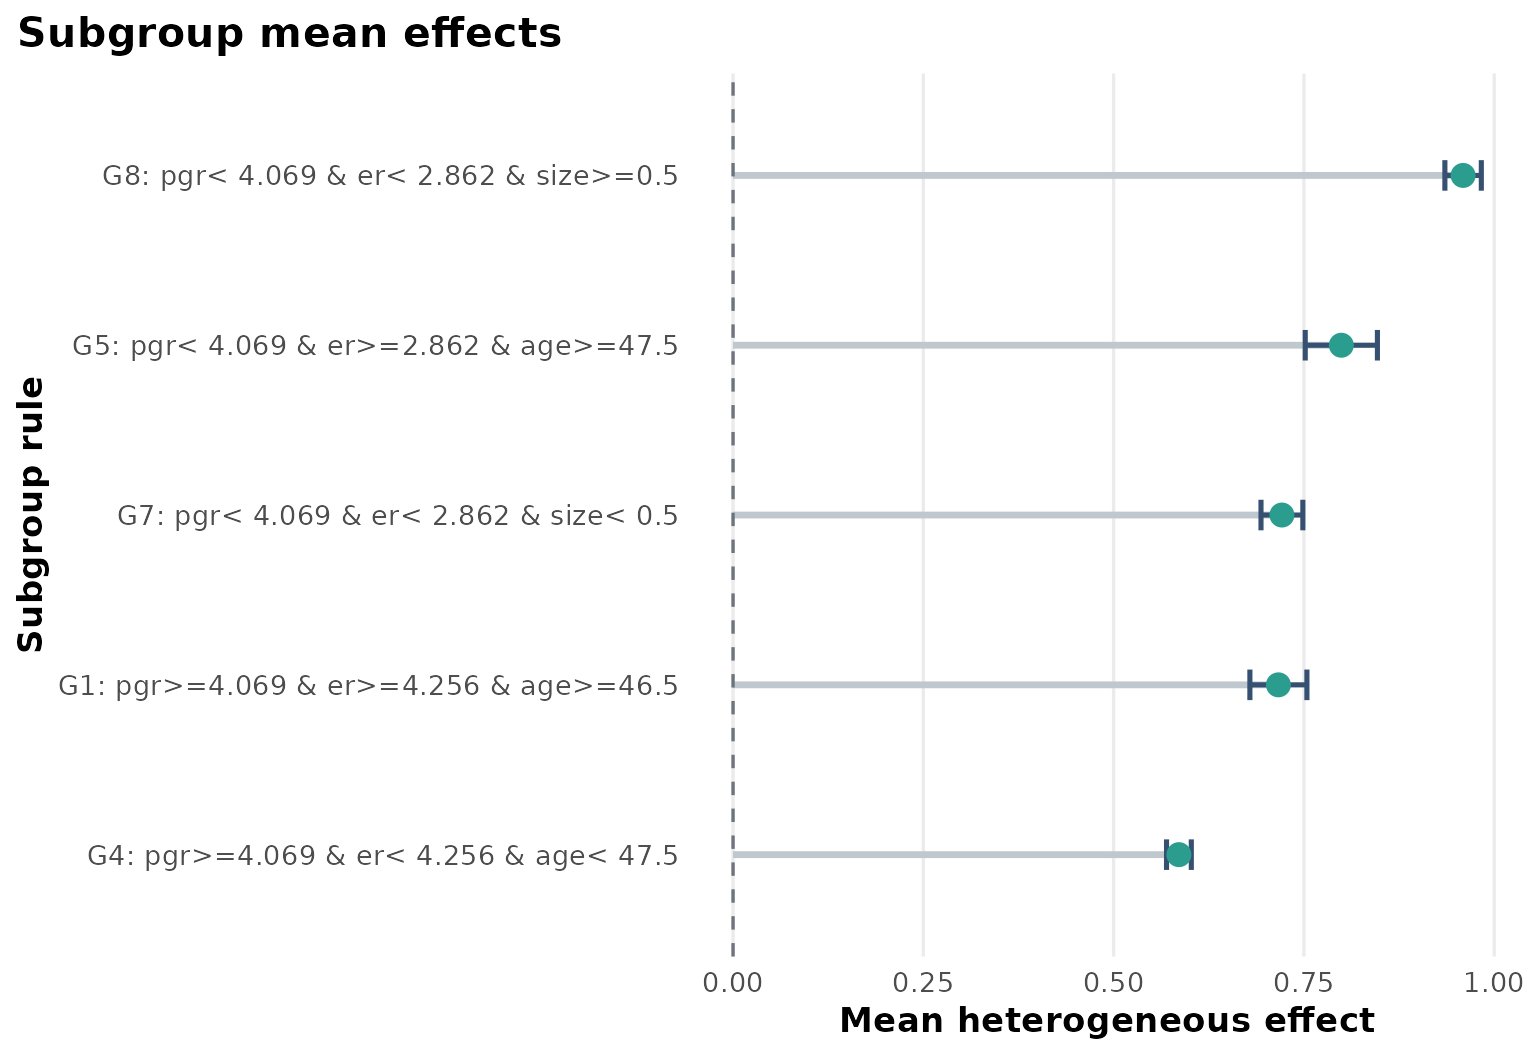
Compared with the simpler survival example, the Rotterdam case produces a more layered subgroup structure. The estimated effects vary across receptor-related and prognostic strata.
Explanation tree
plot_effect_tree(fit)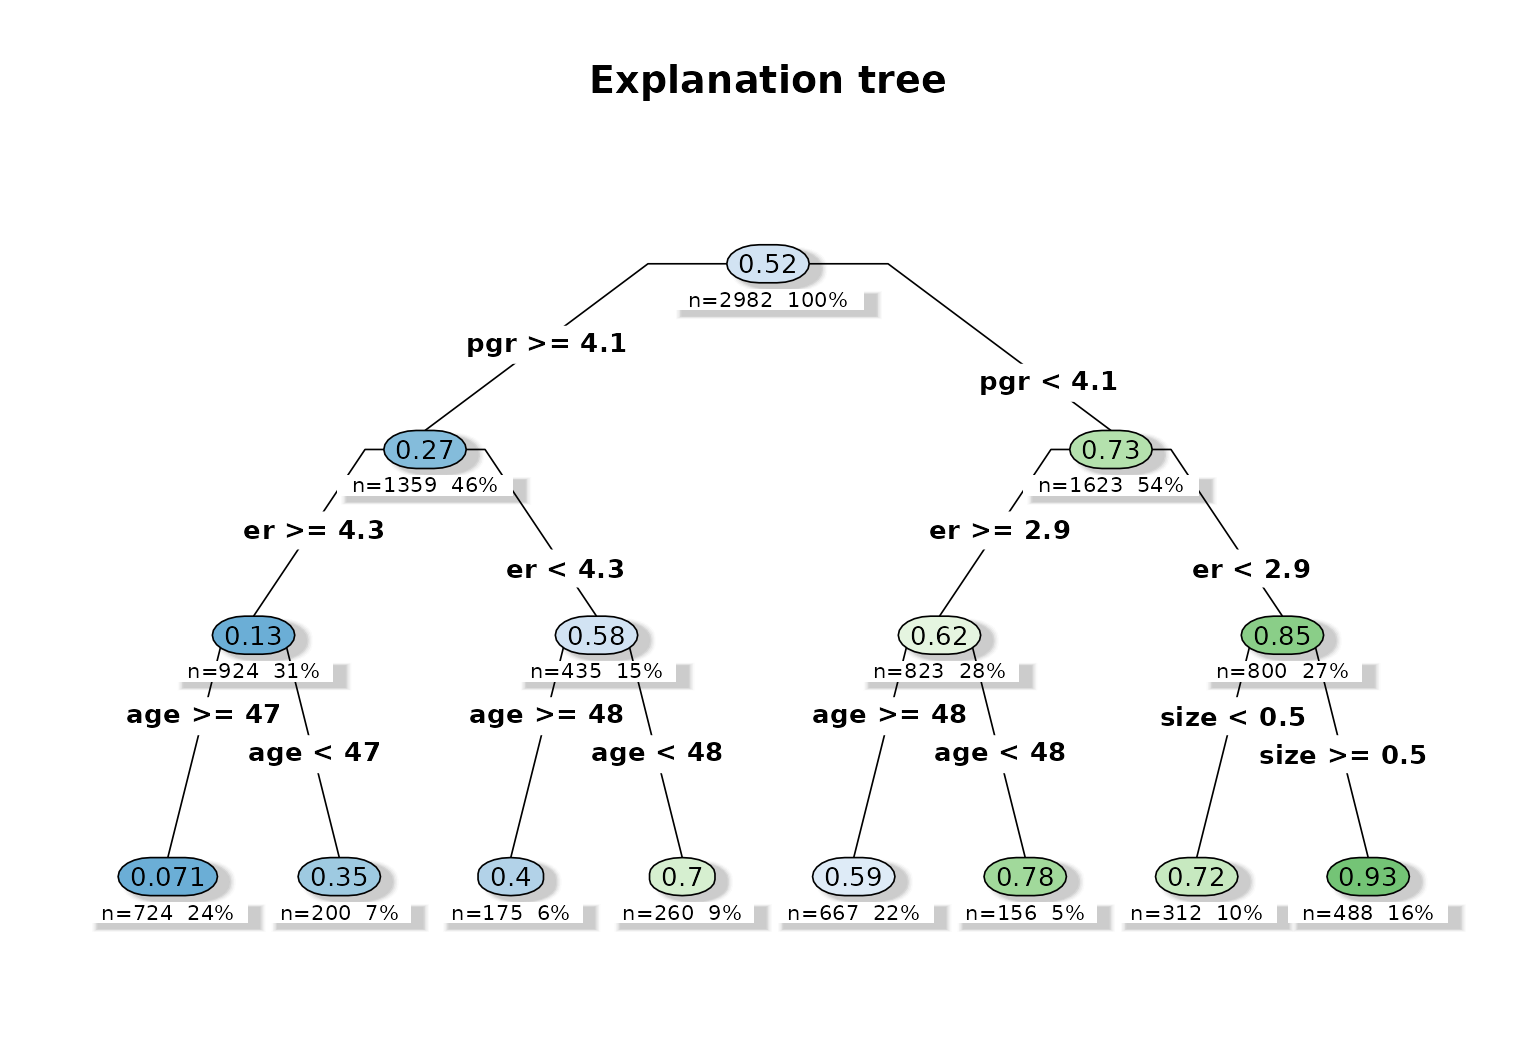
The explanation tree is useful here because it turns a
high-dimensional survival forest into a compact rule system involving
pgr, er, age, and
size.
Variable importance
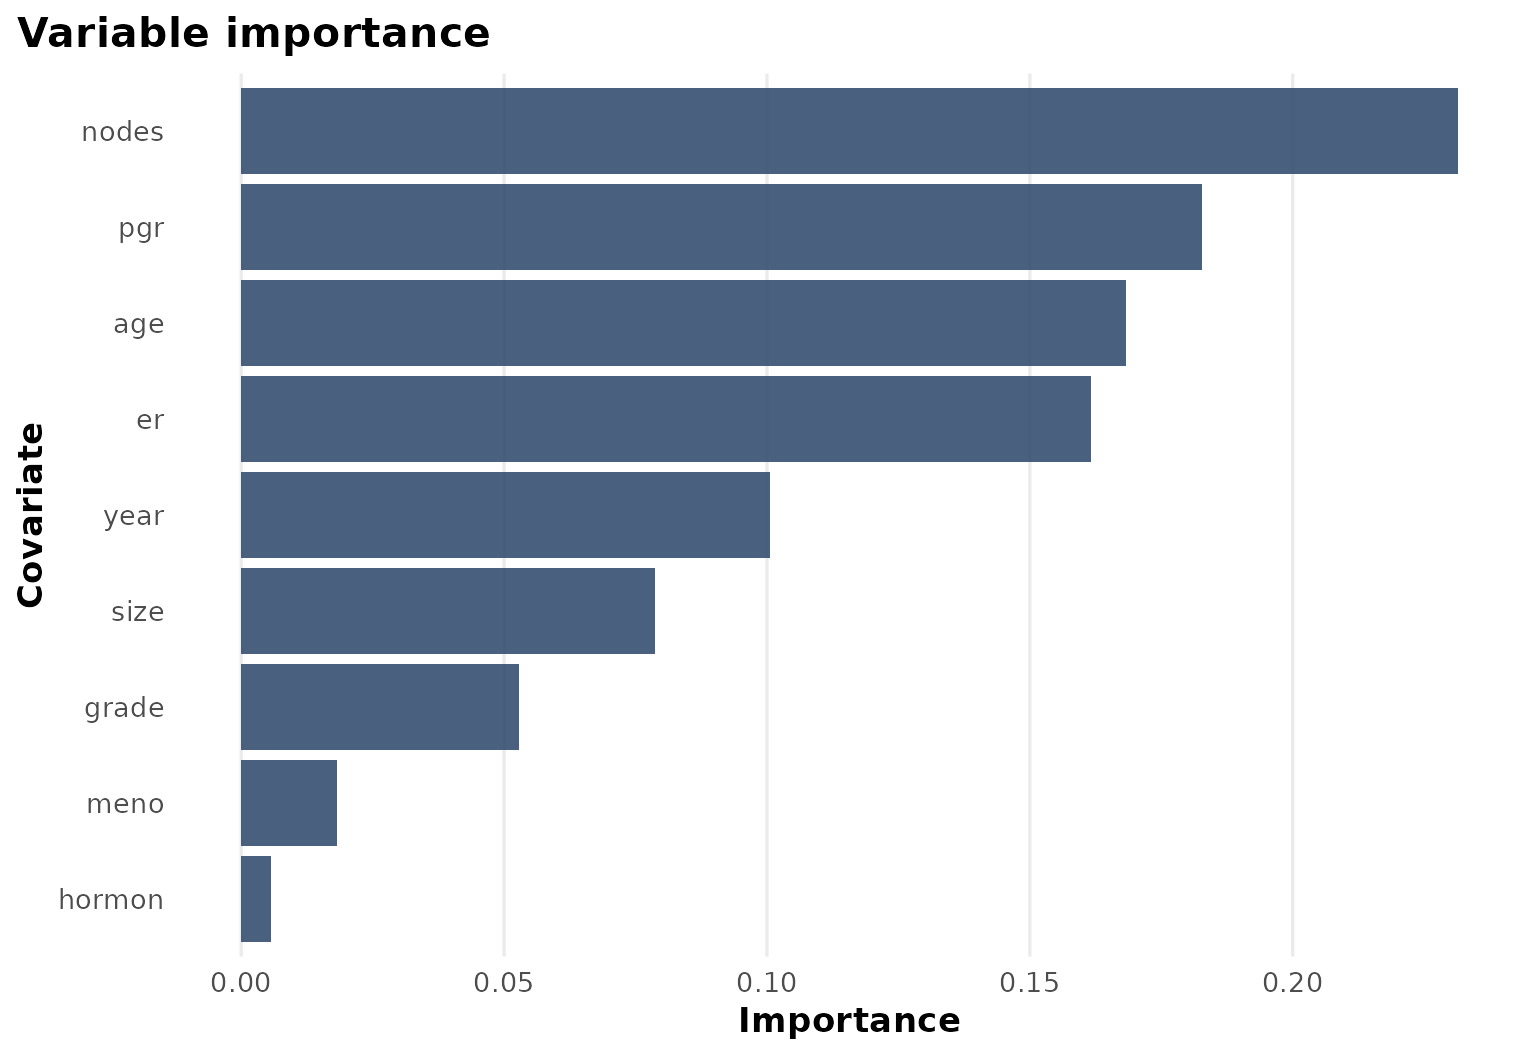
The importance ranking confirms that biologically meaningful covariates drive most of the heterogeneity in this example.